Company research
Everything you need to judge a stock, on one page
Every company page in GetHossa puts long-term results from SEC filings, valuation against the company's own history, analyst expectations and the price's reaction to past earnings side by side, along with your own position if you hold it.
Years of 10-K results
Revenue, net income, EPS and free cash flow, often 15 years or more back, with analyst forecasts as lighter bars.
Cheap or expensive vs itself
Monthly P/E and P/B history with the median and typical range, so today's multiple has context.
Earnings reactions
Each results release is marked on the price chart with the next session's move and the EPS surprise.
What it does
Search for any stock or ETF and GetHossa opens a company page. At the top you see the price, today's move (with pre-market, after-hours or overnight prices for US stocks), market cap, distance from the 52-week high, the next earnings date and the average analyst price target. Below that, for companies:
- Revenue and profits: annual or quarterly revenue, net income and EPS, plus free cash flow for annual data, with year-over-year growth above each bar and analyst forecasts shown as lighter bars with their low–high range.
- Earnings vs expectations: actual EPS against the average estimate for recent quarters.
- Valuation against its history: P/E or P/B for every month, with the current value, the median since the start of the data and the typical range (the middle half of all months). You see at a glance whether the stock is "X% below its median".
- Analyst estimates for upcoming periods: EPS, revenue, growth and the number of analysts.
- Valuation and quality tiles: trailing and forward P/E, PEG, P/B, P/S, EPS, dividend yield, gross, operating and net margins, ROE, revenue and earnings growth, cash, debt and debt to equity.
- Analysts: recommendations and the 12-month price target range against today's price.
- About the company: business description and number of employees.
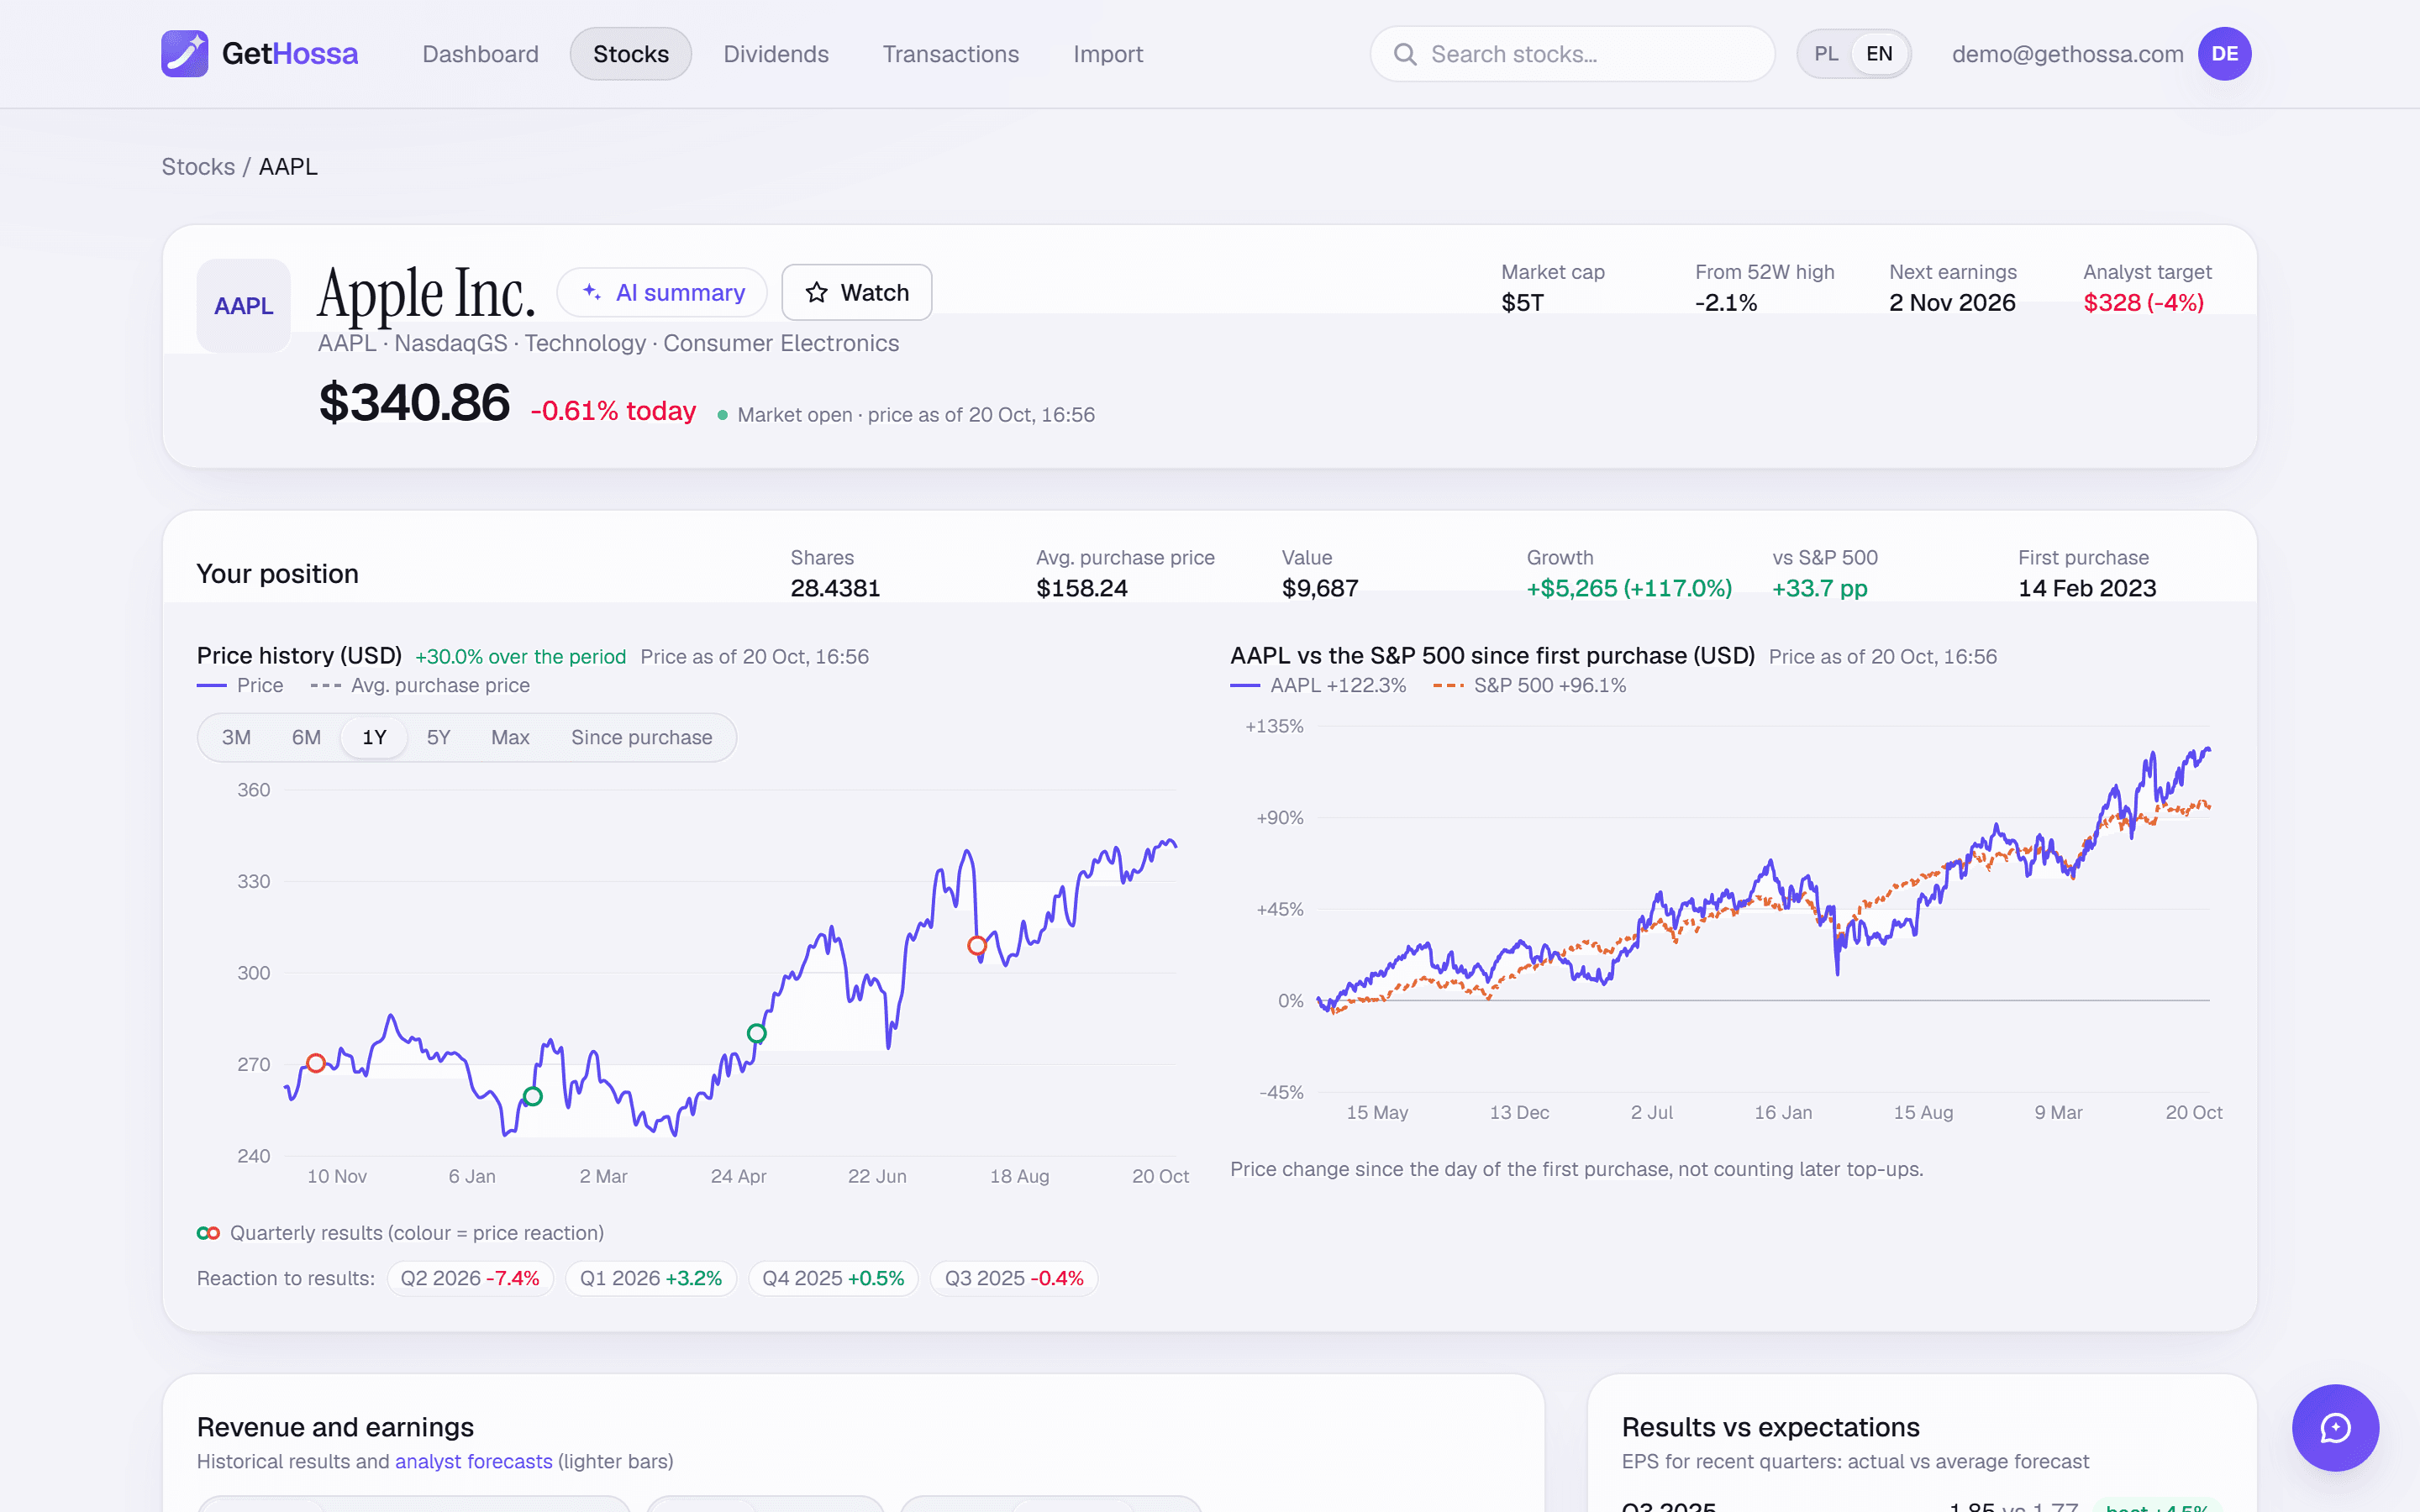
If you hold the stock, a Your position section adds a price chart with your purchases and average cost marked, and a chart of the stock against the S&P 500 since your first purchase.
How it works
- Open a company from the search bar, your holdings table, the watchlist, or a ticker link in an AI assistant answer.
- Read the long-term picture in the financials chart, switching between annual and quarterly data.
- Check the valuation against the company's own past instead of an arbitrary "cheap" threshold.
- Look at the price chart from 3 months to the full history, on a log scale if you like. Each quarterly release is a colored marker showing how the price reacted on the first session after it.
- Ask for an AI summary, or add the stock to your watchlist with one click.
The watchlist on the dashboard flags simple signals: a move of 3% or more today, earnings within 14 days, a price at least 15% below the 52-week high, within 5% of the 52-week low, or below the 200-day average.
Who it's for
- Investors who want long-run context before buying: is a P/E of 28 high for this particular business?
- Holders who want to see how a stock usually reacts to earnings before the next report.
- Anyone who'd rather not jump between a screener, EDGAR and a charting site.
How the numbers are built
For US companies, annual results come from 10-K filings on SEC EDGAR, usually 15 years or more, with per-share values adjusted for later stock splits and merged with Yahoo Finance data. The P/E history divides each month's price by the EPS from the latest fiscal year already published at the time, assuming results become public about 60 days after year-end, so it never uses numbers the market didn't have yet. Earnings dates and times for US companies come from 8-K filings. Details are on the methodology page.
Limits
- Companies outside the US don't file 10-Ks, so their history relies on Yahoo Finance alone and is often shorter.
- ETFs get the price chart, but not financial statements or analyst forecasts.
- Negative earnings leave gaps in the P/E history, since the ratio isn't meaningful.
- Historical EPS is GAAP; forecasts are analysts' adjusted figures, so the two can differ slightly.
- Fundamentals refresh hourly and prices every 5 minutes, delayed about 15 minutes at the source.
Watchlist signals and valuation ranges are mechanical flags, not buy or sell recommendations.
Frequently asked questions
How far back does the financial history go?+
For US companies, typically 15 years or more of annual results from 10-K filings. For companies listed elsewhere it depends on what Yahoo Finance provides, which is usually a few years.
How is the historical P/E calculated?+
Each month's price is divided by the earnings per share of the latest fiscal year that had already been published at that time, assuming results come out about 60 days after the year ends. Months with negative earnings are left blank.
What does the earnings reaction on the chart mean?+
It's the move from the close before the release to the close of the first session after it. For a release after the 4 p.m. close, that's the next trading day.
Can I research stocks I don't own?+
Yes. Any stock or ETF GetHossa can find has a company page, and you can add it to your watchlist to track its signals and earnings date.
Try it on your own portfolio
The account is free. Import your history or add trades by hand — you'll see the result right away.
Create account