Benchmark
Compare your portfolio to the S&P 500
GetHossa invests a shadow portfolio in the S&P 500 with exactly the money you put in, on the days you put it in. You see what that money would be worth today, and a time-weighted return that ignores the timing of your contributions.
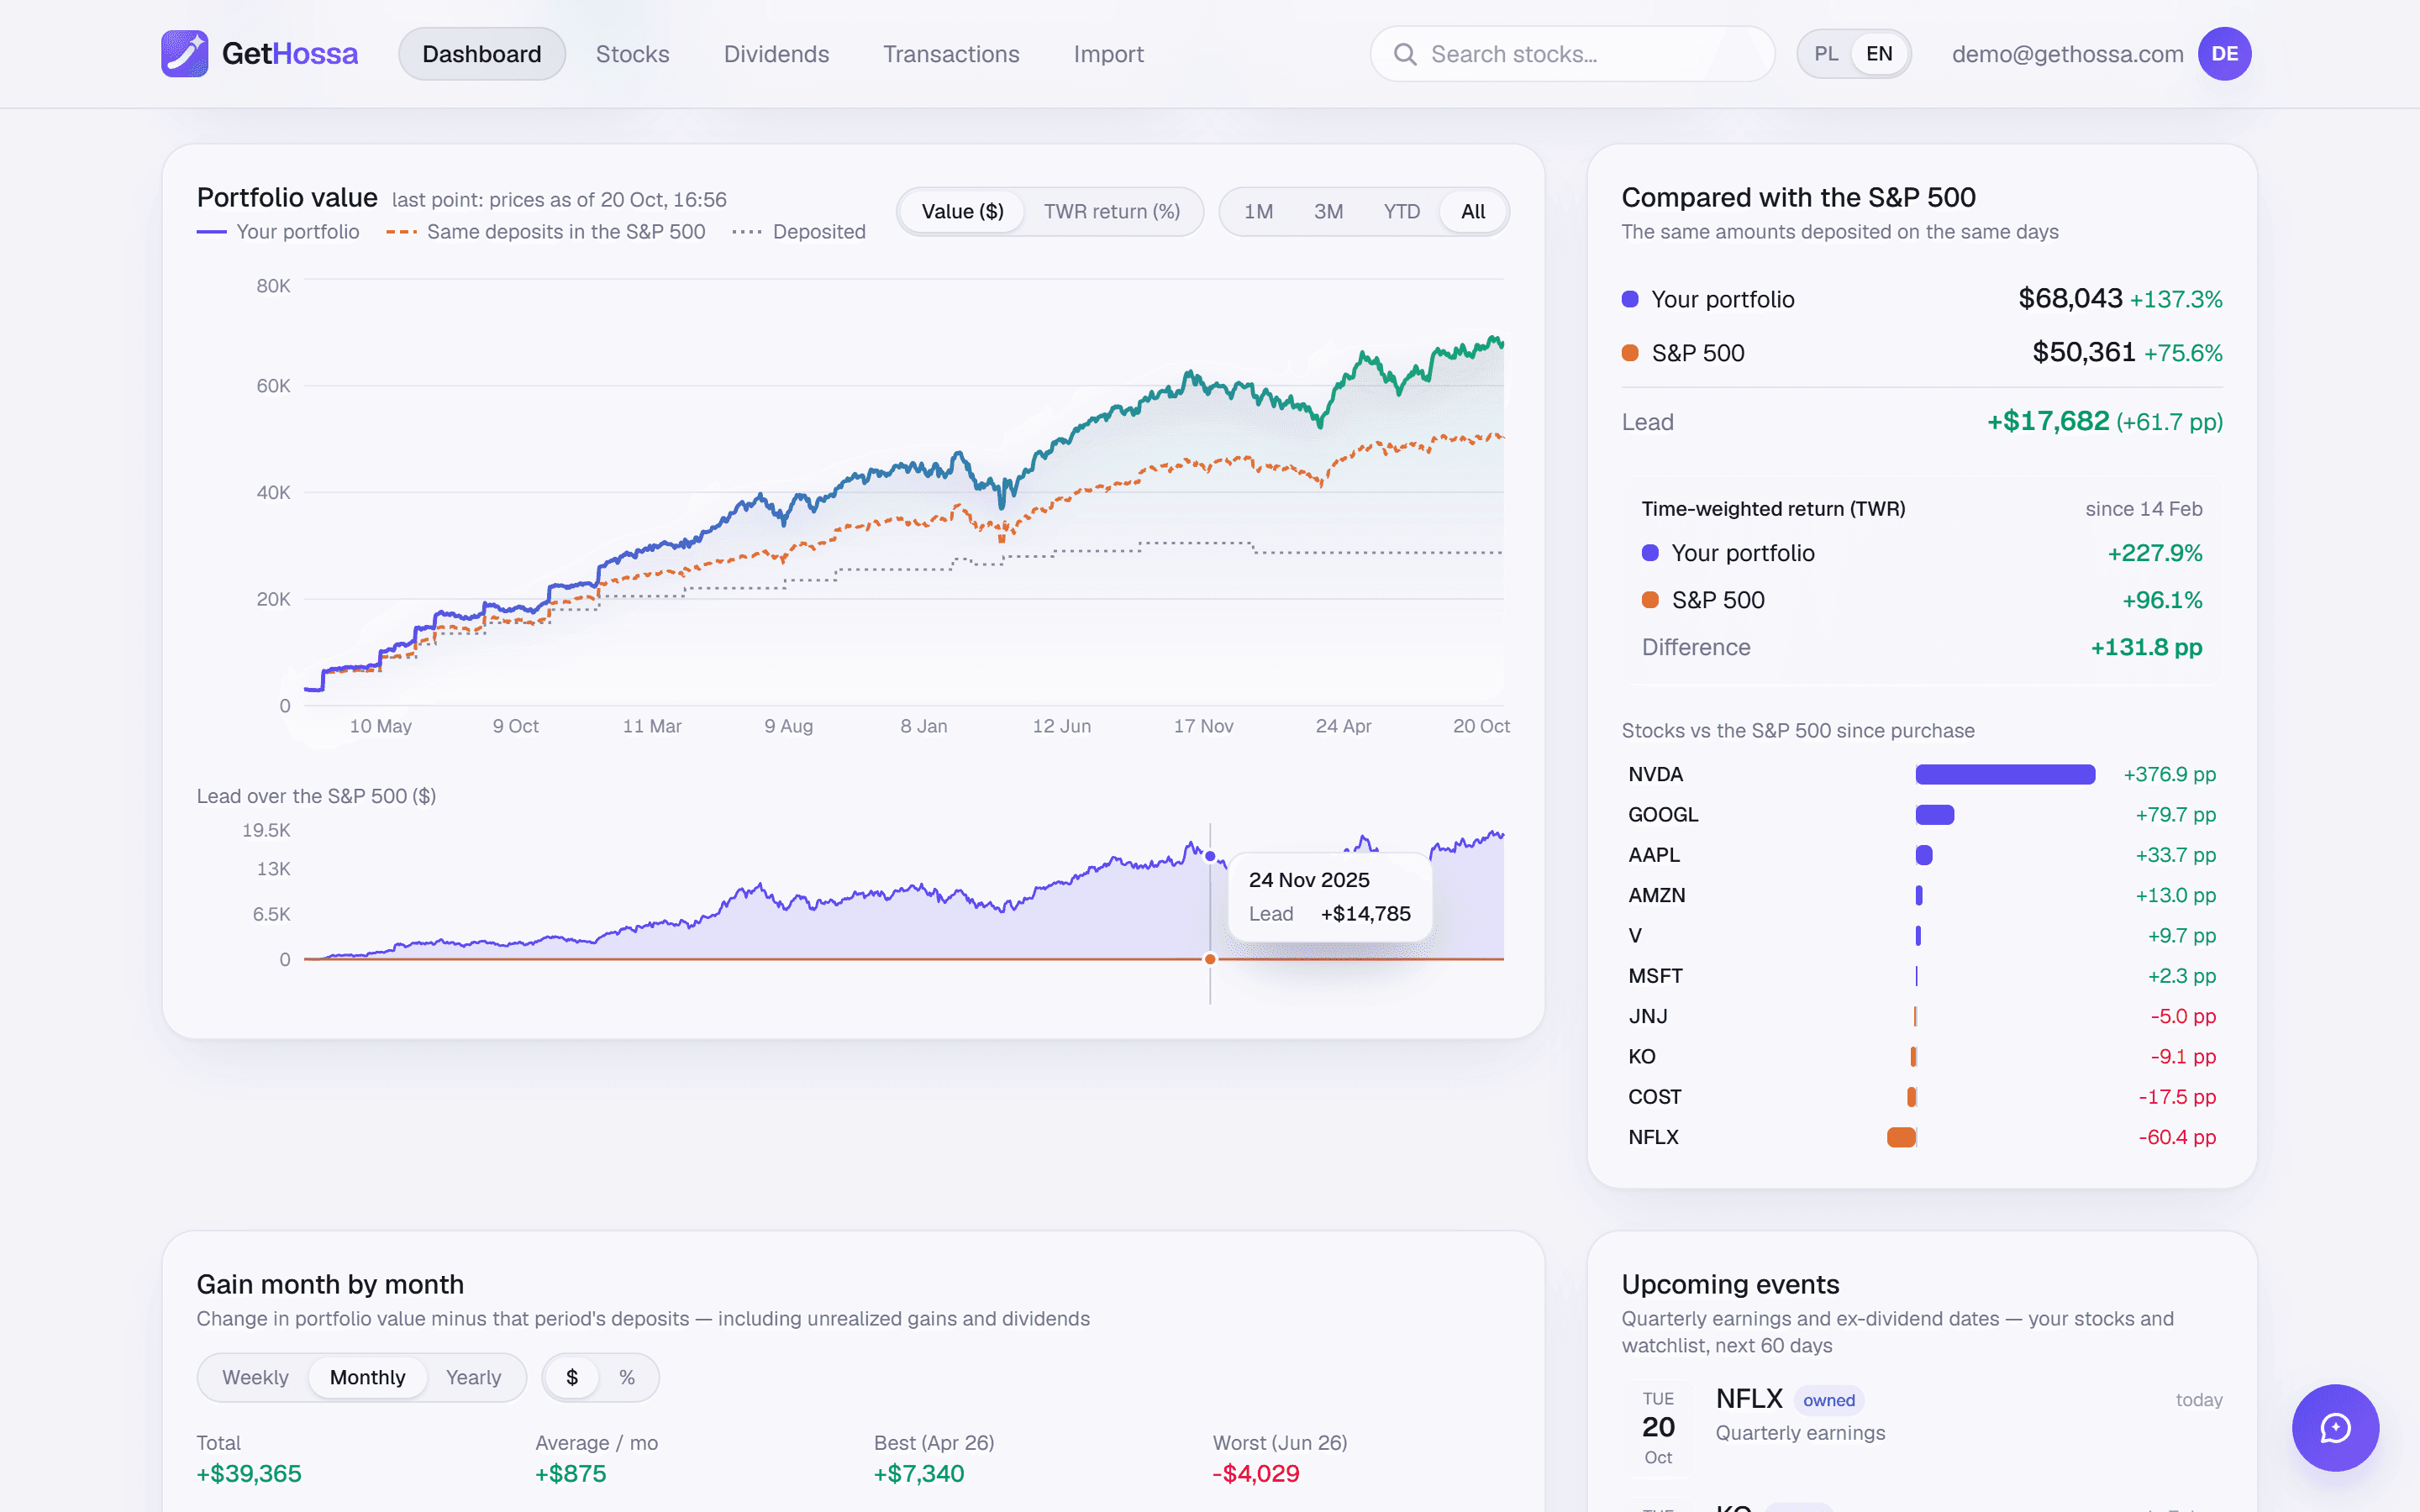
Same dollars, same days
Every purchase also “buys” SPY at that day's close; every sale “sells” the same dollar amount. No guesswork about start dates.
Dividends on both sides
The index uses SPY's adjusted close, so reinvested dividends count. Your own dividends count too.
Every holding against the index
A bar for each stock shows how many percentage points it is ahead of or behind the S&P 500 since you bought it.
What it does
Most brokerage apps show a percentage gain on what you put in. That number can't be put next to the S&P 500's return, because the index figure assumes one lump sum invested on January 1st, while you added money in pieces over months or years. A big deposit right before a rally makes you look like a genius; the same deposit before a sell-off makes good picks look bad.
GetHossa answers the question directly. Next to your real portfolio it keeps a shadow portfolio that holds only the S&P 500 and receives exactly the same cash flows as yours. On the dashboard you see three things side by side:
- Your portfolio: value plus dividends received, and the total return on the money you put in.
- The S&P 500 with the same money: what those same dollars would be worth today if every purchase had gone into the index instead.
- Your lead: the difference in dollars and in percentage points of what you invested.
Below that is the time-weighted return (TWR) for both your portfolio and the index, measured from your first purchase, and a list of every holding with its own lead or lag against the index since you bought it.
How it works, step by step
- Import your trades or add them by hand. An Interactive Brokers Activity Statement can be imported directly; trades from Schwab, Fidelity, Robinhood or any other brokerage can be typed in (date, shares, price, optional fee), along with the dividends they pay. See broker import.
- GetHossa mirrors every cash flow. When you buy $2,000 of a stock on March 3, GetHossa "buys" $2,000 worth of SPY at that day's adjusted close. When you sell and receive $1,500, it "sells" $1,500 of index units at the price on the sale date.
- Both portfolios are valued every day. Prices refresh every 5 minutes during the session, and the value chart shows your portfolio, the index line and the money you invested, over 1 month, 3 months, year to date or all time.
- Switch the chart to TWR. The same chart can show the time-weighted return of both portfolios, rebased to the start of the range you picked, plus the gap between them in percentage points.
A second chart shows your profit week by week, month by month or year by year, in dollars or as a percentage, so you can see which months carried the result.
A quick example
Say you invested $10,000 in January and another $40,000 in June. Your portfolio is now worth $56,000 and you received $400 in dividends, so your total return is $6,400. Had the same $10,000 in January and $40,000 in June gone into SPY, they would be worth $54,900. Your lead is $1,500, or 3.0 percentage points of the $50,000 you invested. The TWR comparison then tells you whether that lead came from better picks or partly from lucky timing of the June deposit.
Who it's for
- Self-directed investors who pick individual stocks and want to know whether it's worth the effort compared with one index fund.
- Investors who contribute regularly, for whom a simple percentage gain is misleading.
- Anyone who holds positions at more than one brokerage and wants one benchmark for all of them.
How it's calculated
The index is tracked through SPY's adjusted close from Yahoo Finance, which includes reinvested dividends, so it measures total return. Your TWR chains daily returns, with each day's purchases and sales counted at the start of the day; the benchmark's TWR uses the same method. Holdings listed outside the US are converted to dollars at the market exchange rate on each trade date. The full formulas, with a worked example of TWR versus simple return, are on the methodology page. For background, read our guide to TWR vs MWR and why time-weighted return is the fair yardstick.
Limits worth knowing
- Cash isn't part of the portfolio. A purchase counts as money going in and a sale as money coming out; uninvested cash at your broker is ignored.
- SPY is a fund. It has a small expense ratio, and its adjusted close reinvests dividends, while dividends in your own portfolio are counted as cash, not reinvested.
- Prices are delayed by about 15 minutes at the source, so during the session your value can differ briefly from your broker's.
- Buys, sells, dividends and stock splits are modelled. Spin-offs, mergers and shares transferred in from another broker can leave your share count or cost different from your broker's records.
The comparison describes the past. It isn't investment advice and says nothing about which strategy will do better next year. Create an account to see your own numbers.
Frequently asked questions
Why does GetHossa show both a dollar lead and a TWR difference?+
They answer different questions. The dollar lead tells you how much more or less money you have than if the same contributions had gone into the S&P 500. The TWR difference strips out the timing and size of your deposits, so it shows whether your picks themselves did better than the index.
Does the S&P 500 comparison include dividends?+
Yes, on both sides. The index uses SPY's adjusted close, which accounts for reinvested dividends, and the dividends you received are added to your portfolio's value before the two are compared.
Can I compare against the Nasdaq or a different index?+
Not at the moment. The benchmark is the S&P 500, tracked through SPY. The dashboard shows today's moves of the Nasdaq, Dow Jones and a few other indices, but they aren't used as benchmarks.
What if I hold stocks listed outside the US?+
They're included. Each purchase and sale is converted to dollars at the market exchange rate on its date, and the current value at today's rate, so the comparison with the S&P 500 is made in dollars throughout.
Try it on your own portfolio
The account is free. Import your history or add trades by hand — you'll see the result right away.
Create account